Pig tracking using Electromagnetic Transmitters is not a new concept, yet we are still uncovering ways to improve detection. Testing by IK Trax challenged the industry standard frequency of 22Hz, revealing that it is not optimal for pig detection. By scrutinising the performance of different frequencies, we aim to optimise pig tracking methods for enhanced reliability and efficiency.
Methodology
The testing explored the implications of using various EM Transmitter frequencies, ranging from 15Hz to 22Hz, on pig detection. IK Trax’s EM transmitters can be wirelessly configured from 10-30Hz using the EMTx Config App. By conducting comprehensive testing in controlled environments, we assess the signal strength at different distances from the pipeline surface. This analysis not only sheds light on the efficacy of lower frequencies but also offers insights into the potential improvements that can be made in pig tracking methodologies.
Setup
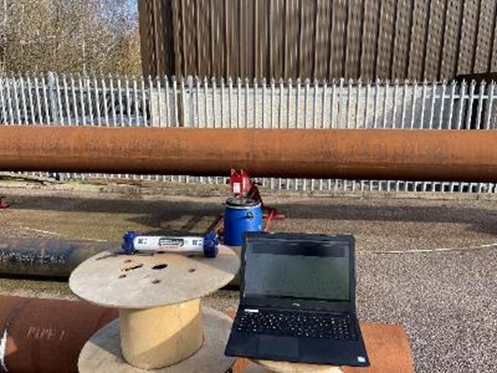
The testing was conducted a 3015X EM transmitter which was placed inside a pig within a 608mm outer diameter, 538mm internal diameter, 35mm wall thickness, 10.5m long pipe. Readings were taken every metre 5m either side of the centre position. At each of these positions 3 readings were taken. These were on the pipe at 0m, 0.5m from the pipe and 1m from the pipe all in air. The image below shows the EMRx at the centre of the pipe 1 m away. The EM Tx was set to 4 different frequencies: 15Hz, 17Hz, 19Hz, 22Hz.
Results in Figure 1 show that reducing the frequency from 22Hz to 15Hz consistently increased the received signal on the pipe. The largest increase was 700 or 58% from 17Hz to 15Hz. Decreasing from 22Hz to 19Hz resulted in a 55% increase, while going from 19Hz to 17Hz saw a 41% increase.
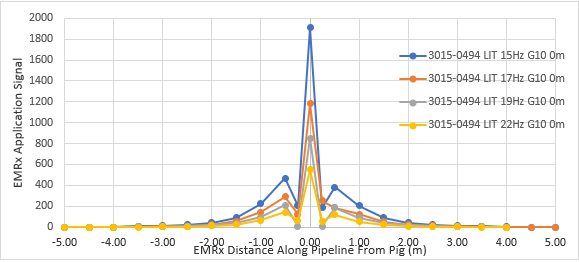
Figure 1: EM Tx @ 15Hz, 17Hz, 19HZ & 22Hz with Receiver 0m from pipe
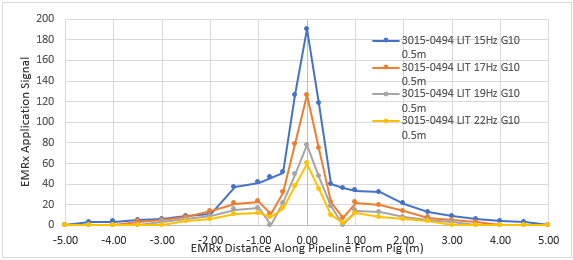
Figure 2: EM Tx @ 15Hz, 17Hz, 19HZ & 22Hz with Receiver 0.5m from pipe
In Figure 3, results at 1m from the pipe demonstrate consistent signal increases with each frequency reduction, at 38%, 50% and 58% respectively. Despite lower signal levels due to increased air attenuation, trends remain similar to previous distances.
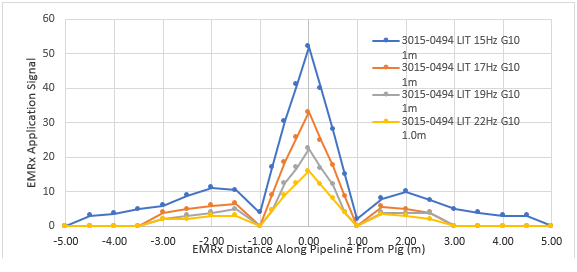
Figure 3: EM Tx @ 15Hz, 17Hz, 19HZ & 22Hz with Receiver 1m from pipe
Conclusion
The results show that with this configuration of pig and pipe parameters, the lower EM frequencies are easier to detect outside the pipe due to the increased received signal levels over those of the higher frequencies at all 3 distances in air from the pipe surface. Our findings highlight how significant reevaluating industry standards can be. These insights can not only lead to improved pig tracking methodologies but also highlight the need for continuous innovation and adaptation.